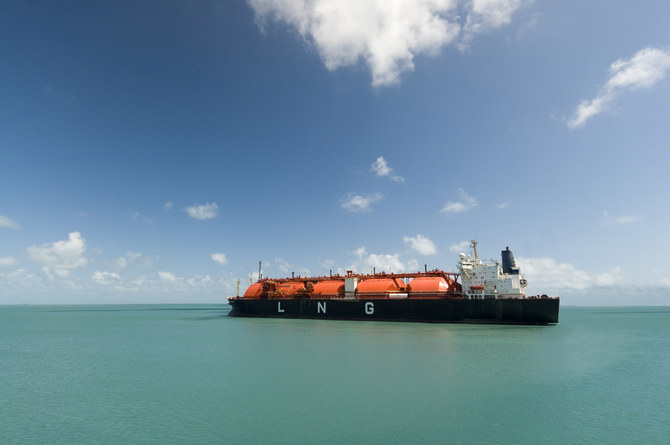

The United States is set to become the world's biggest liquefied natural gas exporter in 2022, surpassing Qatar and Australia, and may hold that title for years to come.
In a year when China and other large economies in Europe and Asia scrambled to source enough supply for heating and power generation, the United States was sitting on a bevy of supply — one that will grow in coming years.
Global LNG demand has hit record highs each year since 2015, due mostly to surging demand in China and the rest of Asia.
Much of that global appetite has been met by steadily rising US LNG exports, which have reached new records every year since 2016 and is poised to continue in 2022.
The US Energy Information Administration projects US LNG exports will reach 11.5 billion cubic feet per day in 2022.
That would account for roughly 22 percent of expected world LNG demand of 53.3 bcfd next year, according to analysts at Goldman Sachs and would outpace both Australia and Qatar, the two largest exporters at present.
One billion cubic feet is enough gas for about 5 million US homes for a day.
The United States should remain the biggest LNG exporter by capacity until around 2025, when Qatar could regain the lead as its North Field expansion starts to enter service.
But if some U.S. developers start building new LNG export plants, the United States may not give up the crown.
Major U.S. developers like Cheniere Energy, the largest US exporter, have signed numerous long-term deals to sell LNG in recent months that should enable them to secure the financing needed to go forward with additional multibillion-dollar projects.
Many of those long-term contracts came from Chinese buyers.
“After years of avoiding a commitment to buy U.S. LNG, Chinese companies have finally made their move,” said Nikos Tsafos at the Center for Strategic and International Studies (CSIS).
So far in 2021, most US LNG exports went to Asia with about 13 pervemt going to South Korea, 13 percent to China and 10 percent to Japan, according to US energy data.
Those were the same top three destinations in 2020 when 13 percent of US LNG went to South Korea, 12 percent to Japan and 9 percent to China.
The growth of US LNG exports helps people worldwide “get greater access to an abundant and reasonably-priced product that helps ease the world’s current supply crunch,” said Charlie Riedl, executive director for the Center for Liquefied Natural Gas.
Gas prices around the world repeatedly reached record highs in 2021 as utilities tried to lock in LNG cargoes to rebuild low stockpiles in Europe and meet heavy demand in Asia.
US gas futures also rose, hitting a 12-year closing high in October.
But after mild weather in early December, US natgas stocks were replenished, and prices overseas are now 11 times higher.
The oil and gas industry touts natural gas as a less polluting fossil fuel than coal or oil.
Gas burns more cleanly, so switching from coal lowers emissions, although unburned gas or methane released to the atmosphere contributes heavily to global warming.
Utilities around the world have been using gas to keep power prices relatively low and maintain reliable electric grids as they meet rising energy demand while transitioning from coal to cleaner renewables. However, some countries, including China, have boosted coal production due to the lack of available LNG.
Analysts at RBN Energy said three developers will probably go forward with new projects over the next year: Cheniere's Stage 3 expansion at Corpus Christi in Texas, Venture Global's Plaquemines in Louisiana and Tellurian Inc's Driftwood in Louisiana.


